LLVM
Debugging Clang Static Analyzer
Guide to analyzing a Clang Static Analyzer issue
STEP 1
Create a small reproducer testcase
STEP 2
Run the clang static analyzer using the following command
scan-build -o . clang -c test.c
STEP 3
Run the scan-view command (generated by launching the above analysis) to view the results
scan-view /home/saurabh/clangsa/2020-07-09-103350-238389-1
This will open the analysis report in a user friendly format.
- If you are using a shell (which I do), this will open the report in ELinks. Navigate the report in a terminal as follows:
- Use the UP and DOWN arrow keys to jump between different links
- Use the FORWARD and REVERSE arrow keys to navigate between next and previous pages of the report
- When selecting a particular link or arrow in the report, press ENTER to open the link
- Use the FORWARD and REVERSE arrow keys to navigate between next and previous pages of the report
Alternatively, you can also open the generated index.html in a web browser. This is generated inside the directory created with a name similar to 2020-07-09-103350-238389-1
The HTML report looks as follows: 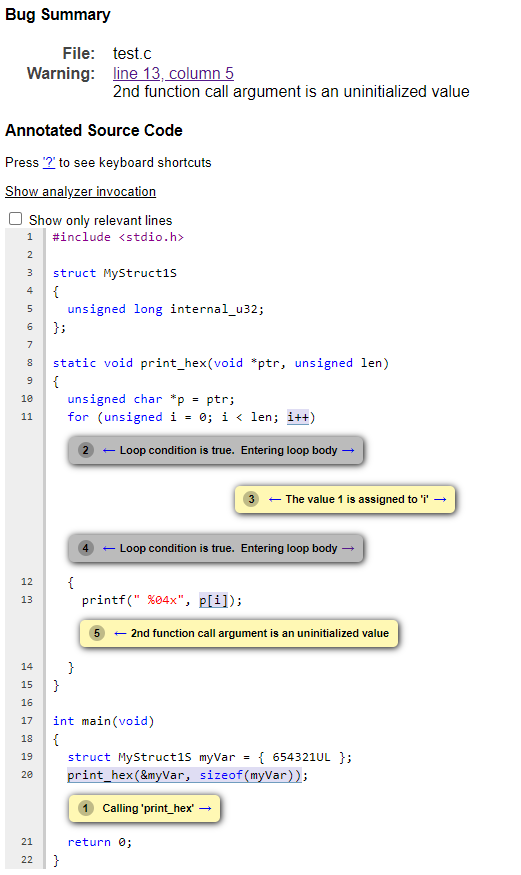
STEP 4
Navigate to the Show analyzer invocation< section of the Bug Report and copy the command with complete set of command line flags to invoke the analyzer The command should looks as follows:
clang -cc1 -cc1 -triple x86_64-unknown-linux-gnu -analyze -disable-free -main-file-name test.c
-analyzer-store=region -analyzer-opt-analyze-nested-blocks -analyzer-checker=core
-analyzer-checker=apiModeling -analyzer-checker=unix -analyzer-checker=deadcode
-analyzer-checker=security.insecureAPI.UncheckedReturn -analyzer-checker=security.insecureAPI.getpw
-analyzer-checker=security.insecureAPI.gets -analyzer-checker=security.insecureAPI.mktemp
-analyzer-checker=security.insecureAPI.mkstemp -analyzer-checker=security.insecureAPI.vfork
-analyzer-checker=nullability.NullPassedToNonnull -analyzer-checker=nullability.NullReturnedFromNonnull
-analyzer-output plist -w -setup-static-analyzer -mrelocation-model static -mframe-pointer=all
-fmath-errno -fno-rounding-math -mconstructor-aliases -munwind-tables -target-cpu x86-64
-dwarf-column-info -fno-split-dwarf-inlining -debugger-tuning=gdb
-resource-dir /home/saurabh/llvm-project/build/lib/clang/11.0.0 -internal-isystem /usr/local/include
-internal-isystem /home/saurabh/llvm-project/build/lib/clang/11.0.0/include
-internal-externc-isystem /include -internal-externc-isystem /usr/include
-fdebug-compilation-dir /home/saurabh/clangsa -ferror-limit 19 -fgnuc-version=4.2.1
-analyzer-output=html -faddrsig -o /home/saurabh/clangsa/2020-07-09-103350-238389-1 -x c test.c
STEP 5
Dump the complete exploded graph of the input source code in a .dot file. The exploded graph can be used to view the program states and environment information of the input source code at various program points. Add the following flag to the command obtained above to dump the exploded graph while invoking the static analyzer
-analyzer-dump-egraph=graph.dot
STEP 6
Generate and view the exploded graph dumped above in a user friendly format. The following command will generate the exploded graph representation in HTML files which can be viewed in a web browser. The utility exploded-graph-rewriter.py can be found at llvm-project/clang/utils/analyzer/exploded-graph-rewriter.py in the LLVM repository
Prerequisites
- Specific versions of python2 (2.7.16 in my case) is needed to run the above utility and generate HTML files
- The HTML files by default are generated in /tmp and automatically launched in a browser. So it needs to be launched from a terminal with $DISPLAY access
exploded-graph-rewriter.py graph.dot